How To Debug PHP using Xdebug, Visual Studio Code, and Docker On Windows
This tutorial provides all the steps required to debug PHP applications containerized with Docker containers using Xdebug and Visual Studio Code or VS Code on Windows.
In this tutorial, we will discuss the terms specific to debugging and the steps required to debug PHP programs using Xdebug 3 and Visual Studio Code or VS Code for PHP applications containerized using Docker containers on Windows 10. It assumes that Docker and Visual Studio Code are already installed on the Windows system.
You can also follow How To Install Docker Desktop On Windows 10, Containerize PHP with Apache, MySQL, and MongoDB using Docker Containers, Containerize PHP with NGINX, MySQL, and MongoDB using Docker Containers, and How To Install VSCode For PHP On Windows.
Notes: I am following Containerize PHP with NGINX, MySQL, and MongoDB using Docker Containers for this tutorial.
Debugging Terms
This section explains all the major terms specific to debugging. These are listed below.
Current Instruction Pointer - The instruction pointer pointing to the current statement where the debugger is paused and waiting for the next instructions.
Breakpoint - The program execution pauses at the breakpoint until further instructions are not provided by the debugger. The breakpoints are added intentionally to check the program for possible errors.
Step Into - Move to the next statement in case there is no function call or enter the function to debug it in case there is a function call on the current statement. We can step into the function called on the current statement to further check it. The execution will pause at the first statement of the function.
Step Out or Step Return - Execute the remaining statements of the function completely and move out of the function and set the instruction pointer on the statement next to the function call.
Step Over - Execute the current statement without going into the function if it's there. It skips the function and executes it without entering into it.
Resume - Resume the execution as the program executes normally till the next breakpoint encounters. The program execution will pause at the next breakpoint if there is any.
Pause - Pause the current execution. The instruction pointer will point to the statement where the execution pause.
Stop - Terminate the current execution of the program and clear the variables stack and breakpoints from memory.
Install Xdebug
To demonstrate using Xedug for PHP, I will use the same setup done in Containerize PHP with NGINX, MySQL, and MongoDB using Docker Containers. In this step, we will create the Xdebug configuration file and also update the PHP Dockerfile to install and configure Xdebug for PHP.
# docker-compose.yml
....
....
  php:
    container_name: php
    build: ./docker/php
    ports:
      - "9000:9000"
    volumes:
      - ./src:/var/www/html
      - ./xdebug:/var/logs/xdebug
    working_dir: /var/www/html
....
....
# docker/php/xdebug.ini
zend_extension=xdebug

[xdebug]
xdebug.mode=develop,debug
xdebug.client_host=host.docker.internal
xdebug.start_with_request=yes
xdebug.log='/var/logs/xdebug/xdebug.log'
xdebug.connect_timeout_ms=2000
# docker/php/Dockerfile
FROM php:8.1-fpm

RUN apt-get update
RUN apt-get install -y autoconf pkg-config libssl-dev

# MySQL
RUN docker-php-ext-install pdo pdo_mysql mysqli

# MongoDB
RUN pecl install mongodb
RUN echo "extension=mongodb.so" >> /usr/local/etc/php/conf.d/mongodb.ini

# Xdebug
RUN pecl install xdebug-3.1.2
ADD xdebug.ini /usr/local/etc/php/conf.d/xdebug.ini
Now, run the build and up commands of Docker Compose.
# Build
docker-compose build

# Output
mysql uses an image, skipping
phpmyadmin uses an image, skipping
mongo uses an image, skipping
mongo-express uses an image, skipping
Building php
....
....
 => [7/9] RUN pecl install xdebug-3.1.2                                                                           27.7s
 => [8/9] RUN docker-php-ext-enable xdebug                                                                         0.9s
 => [9/9] ADD xdebug.ini /usr/local/etc/php/conf.d/xdebug.ini                                                      0.1s
 => exporting to image
....
....
# Up
docker-compose up

# Output
Starting mongo ... done
Starting php        ... done
Starting mysql ... done
Starting pma        ... done
Recreating mexpress ... done
Starting nginx      ... done
Attaching to mysql, mongo, php, pma, nginx, mexpress
....
....
php              | [14-Dec-2021 02:36:42] NOTICE: fpm is running, pid 1
php              | [14-Dec-2021 02:36:42] NOTICE: ready to handle connections
....
....
We can verify whether Xdebug is installed by checking the PHP info output as shown in Fig 1.
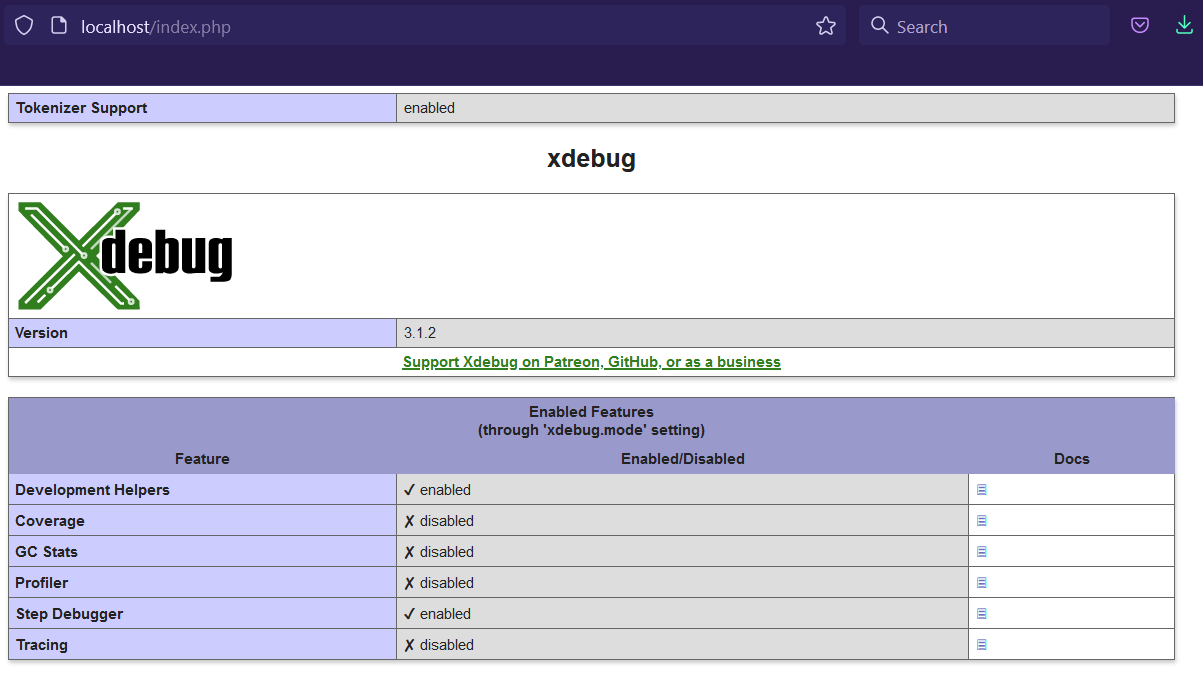
Fig 1
Install Xdebug extension for VS Code
In this step, we will install the Xdebug adapter by Felix Becker for Visual Studio Code. Click the Extensions Icon on the Activity Bar on the left side and search for xdebug. It will list down the available extensions for Visual Studio Code as shown in Fig 2.
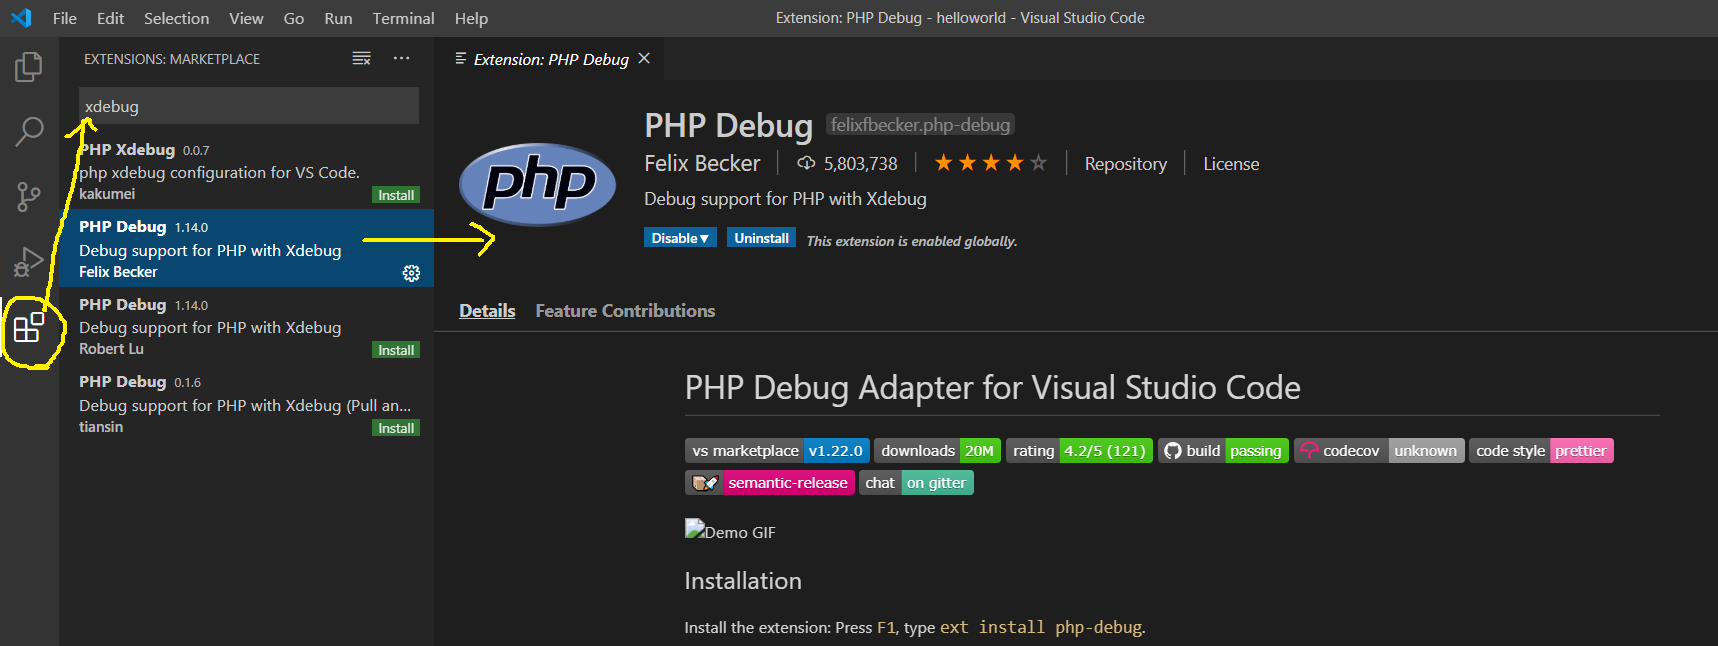
Fig 2
In my case, it shows that the PHP Debug is already installed. You can click the Install Button in case it's not installed yet.
Debug PHP using Xdebug and VS Code
In this step, we will open the folder having PHP scripts and add our script for debugging. Now, click the File Option on the top Menu Bar and click the Open Folder Option from the child menu. Also, browse for the folder having the PHP code. It should open the folder as shown in Fig 3.

Fig 3
Now, right-click the src folder and click the New File option. Also, enter the file name as debug.php and hit Enter. It should create the file as shown in Fig 4.

Fig 4
Next, add some code for debugging purposes as shown in Fig 5.

Fig 5
Now, add breakpoints on lines 2 and 6 by clicking on the area at the left of the line numbers as shown in Fig 6.

Fig 6
We also need to configure the Visual Studio Code to debug our code. Click the Run Icon on the Activity Bar on the left side to start configuring for xdebug. It should show the options as shown in Fig 7.

Fig 7
Now, click the create a launch.json file to configure the project for debugging. It will show the options to choose the environment as shown in Fig 8.

Fig 8
Now, select PHP as the environment for the launch.json file. It will create the file as shown in Fig 9.
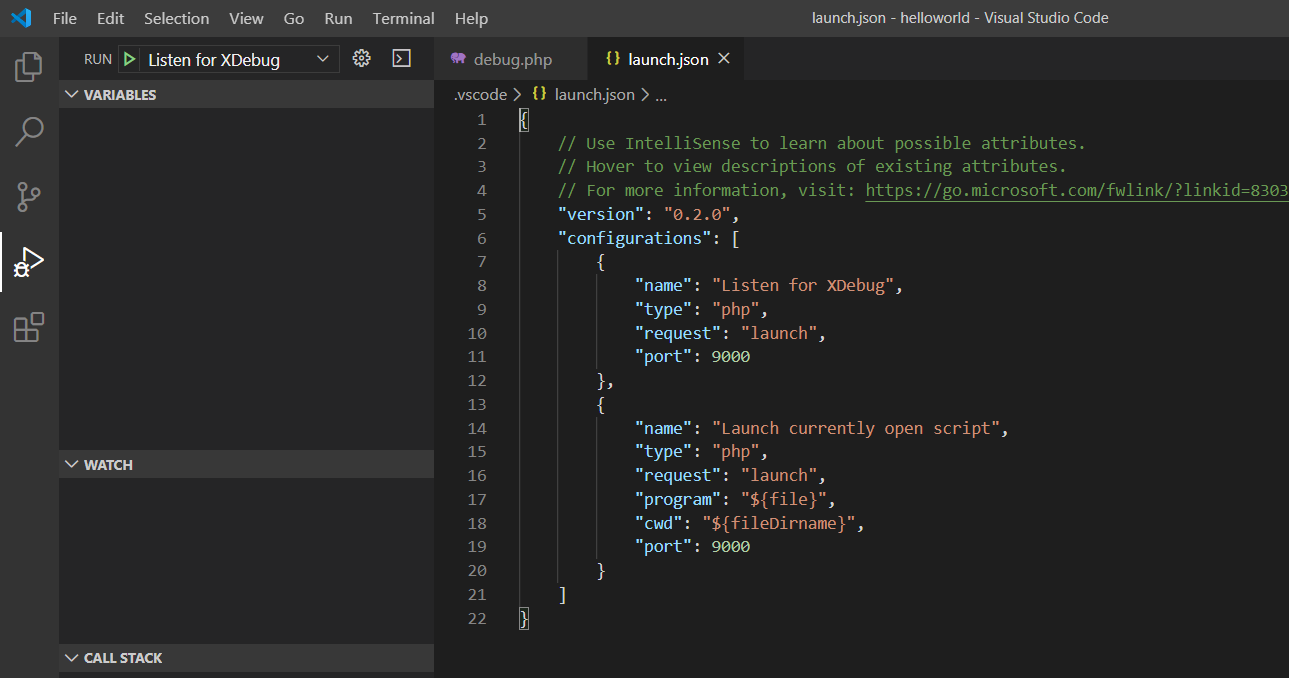
Fig 9
It consists of two debugging configurations including Listen for XDebug and Launch currently open script. We will update the configuration Listen for XDebug as shown in Fig 10.
I have updated the configuration to map the folder on the Server (left), with the source code folder (right). Also, I have updated the port to 9003 which is the default port for Xdebug 3.
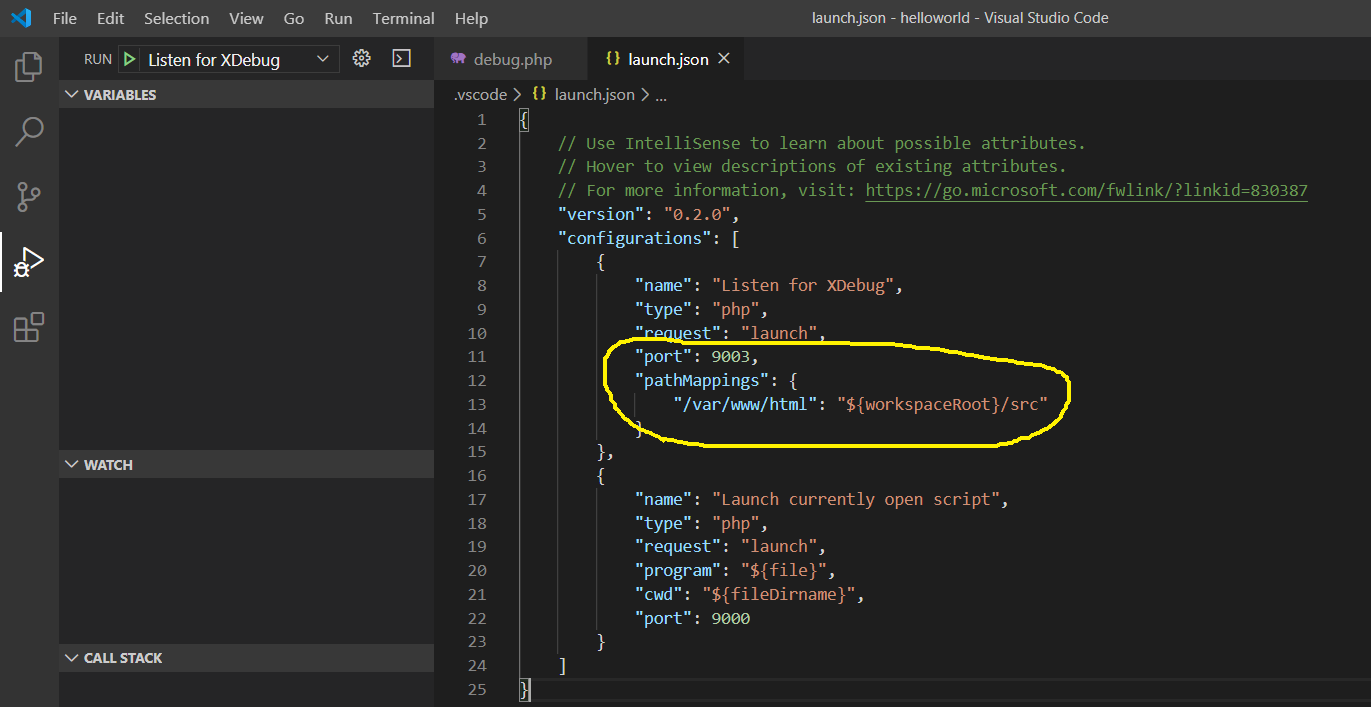
Fig 10
At last, we will start the debugging session to listen to the breakpoints added by us. Also, make sure to keep the Docker Container running before starting the debugging session. Now, click the green-colored Play Icon at the top right side of VS Code. It will start the debugging session and shows the debugging toolbar at the top center area of the editor which contains the debugging controls to debug our code. It will also change the bottom status bar color to orange as shown in Fig 11.
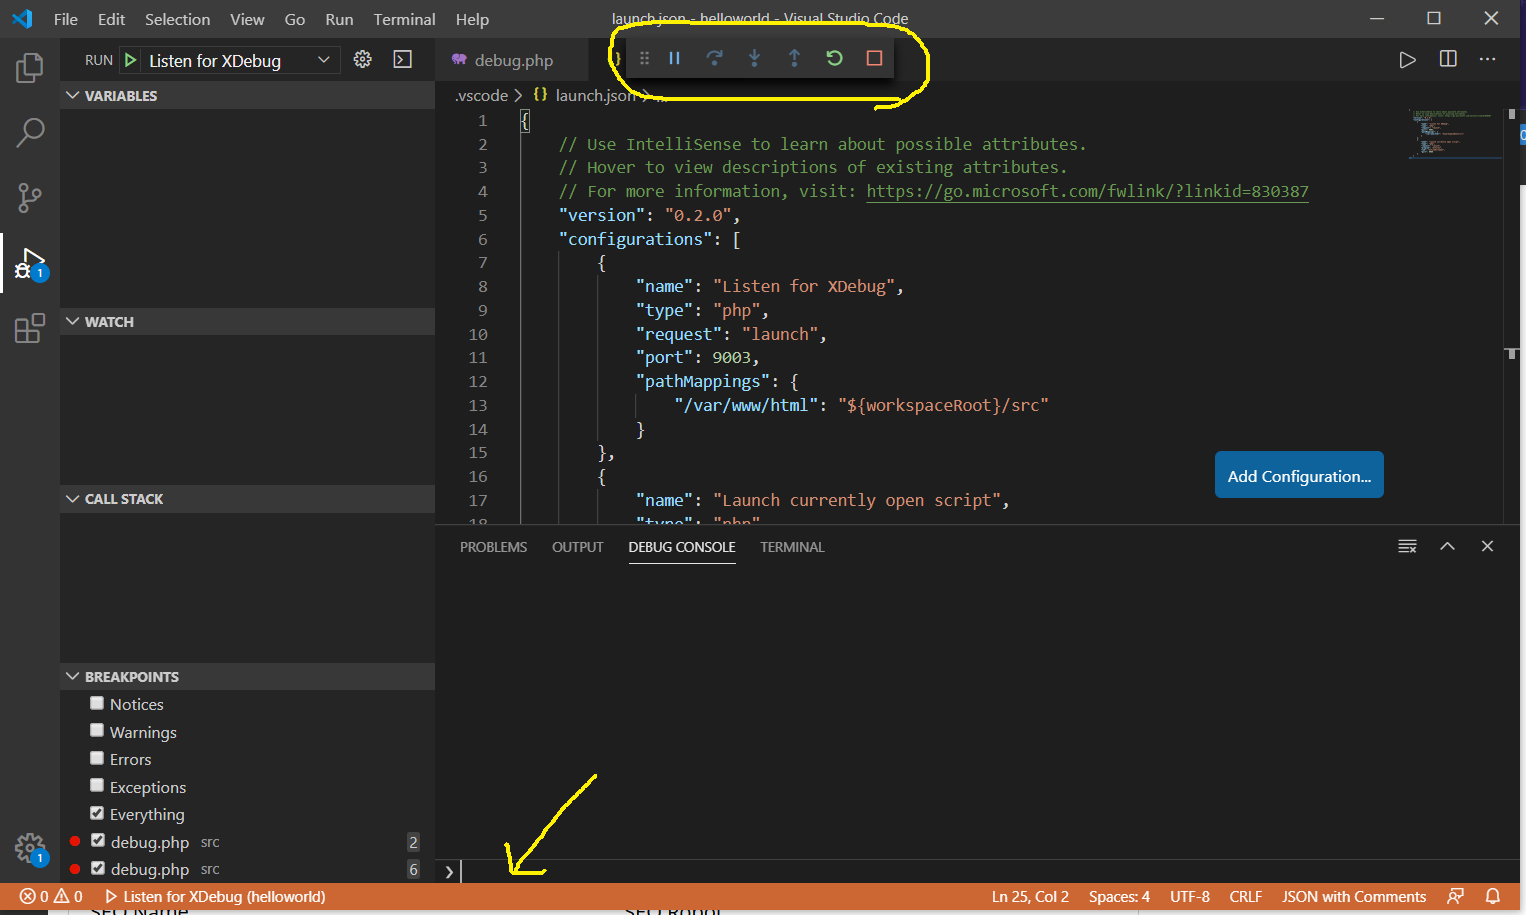
Fig 11
Now try to access the debug.php script from the browser using the URL - http://localhost/debug.php. In the beginning, the debugger will pause at the first breakpoint added by us at line number 2 as shown in Fig 12. Also, Visual Studio Code will maintain the variables and methods call stack as shown in Fig 12.
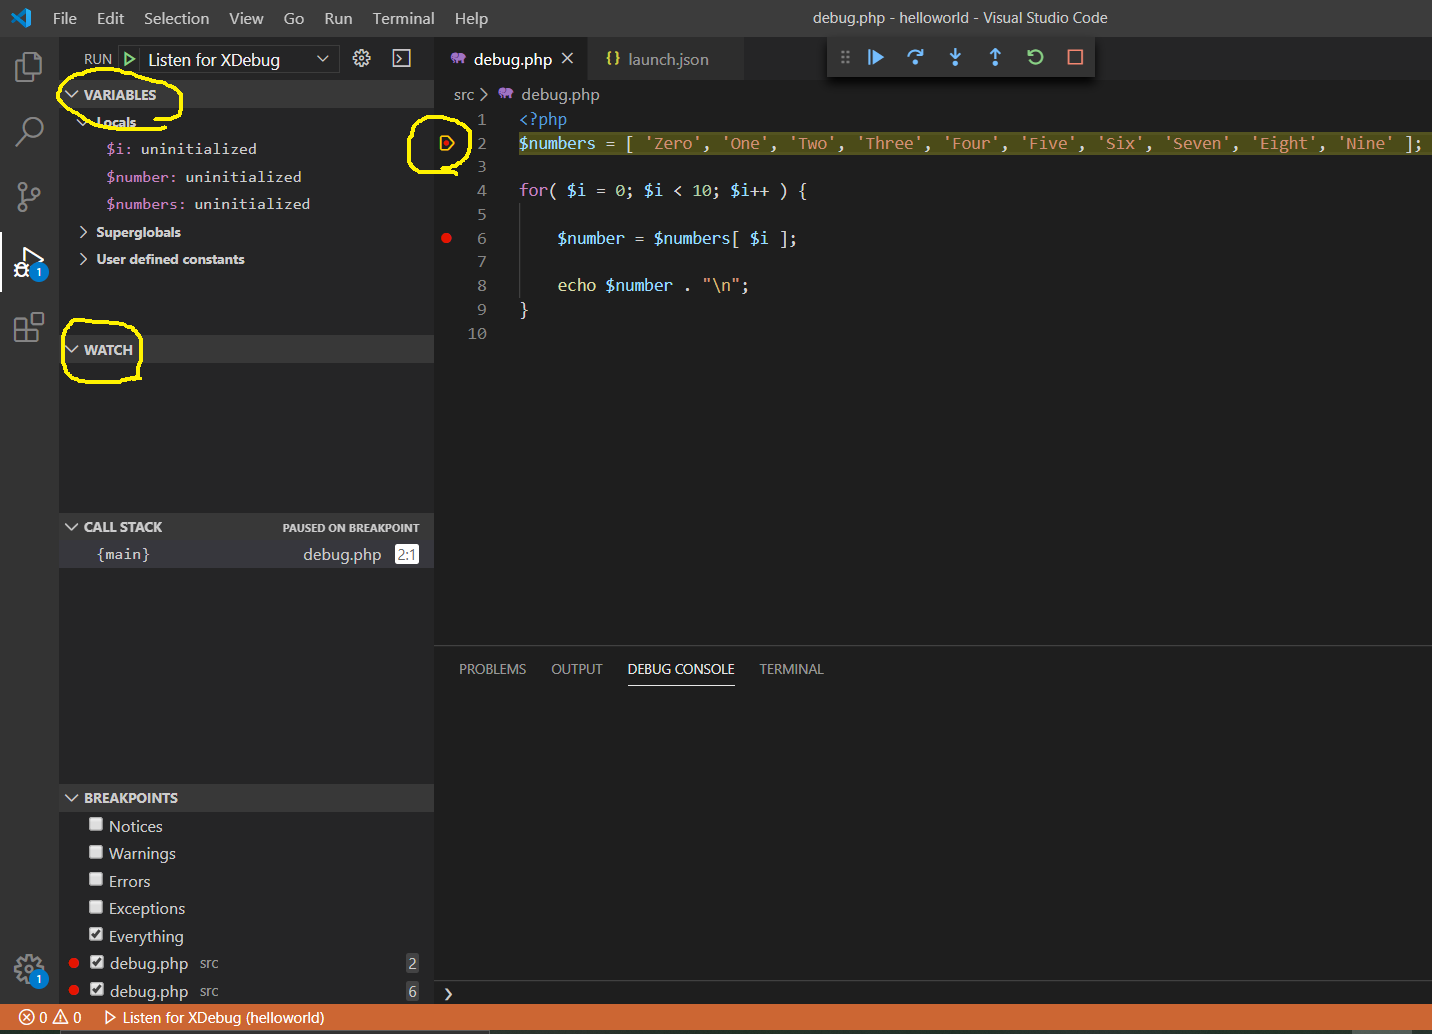
Fig 12
The Web Server may timeout during the debugging session and shows a 504 error. We can either comment out the Xdebug configuration connect_timeout_ms by updating the xdebug.ini file or increase the time limit to give us enough time to debug our code.
Now, click the Step Over Icon or press F10 to move to the next step. We can also click the Continue Icon to move to the next breakpoint. Also, keep a note of the variables stack after clicking the Step Over Icon. It should initialize the variable $numbers in the example given by me and as highlighted in Fig 13. Also, check the call stack as highlighted in Fig 13.
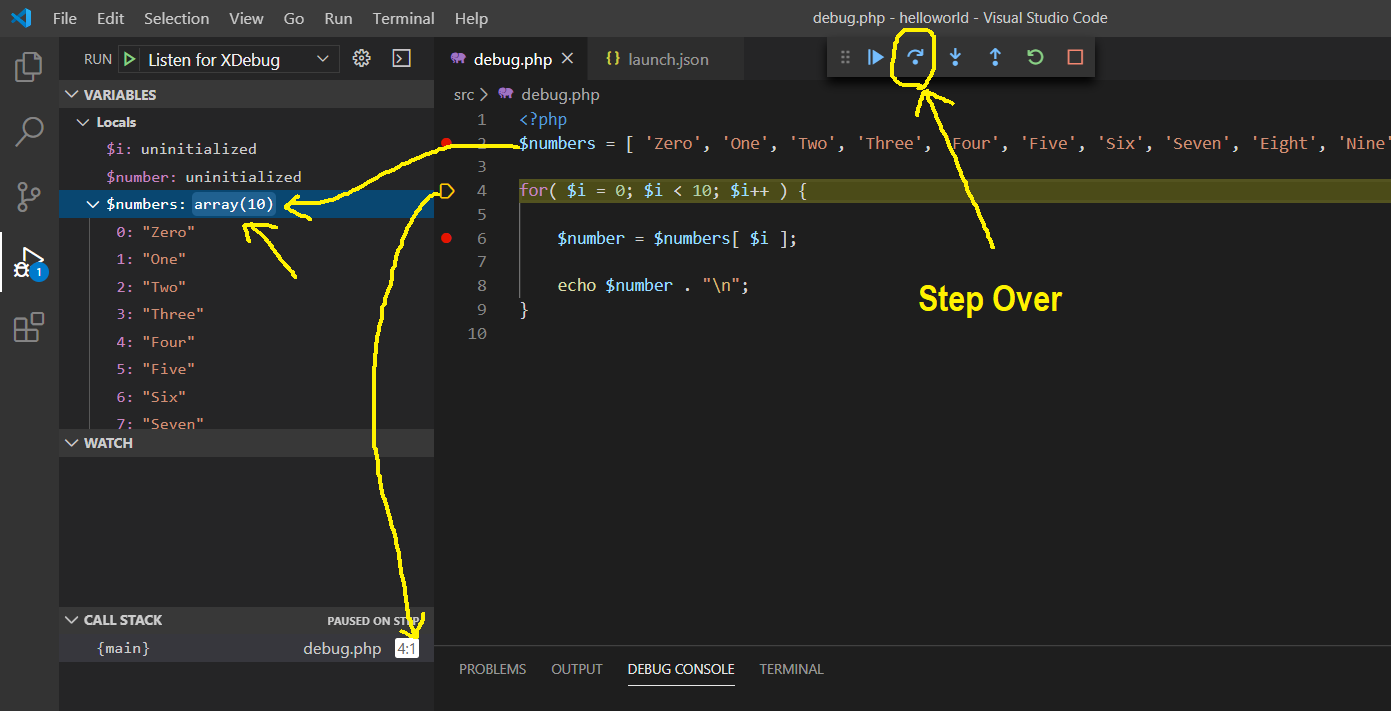
Fig 13
Now again press F10 to move the execution to the next statement. It should initialize the $i variable to 0. We can click the Continue Icon or press F5 to move to the next breakpoint which is the same i.e. line number 6 in our case. Also, check the value of the variables $i and $number after clicking the Continue Icon as shown in Fig 13. We can keep on debugging our code till we are done.
We can always click the Stop Icon or press Shift + F5 to stop the execution.
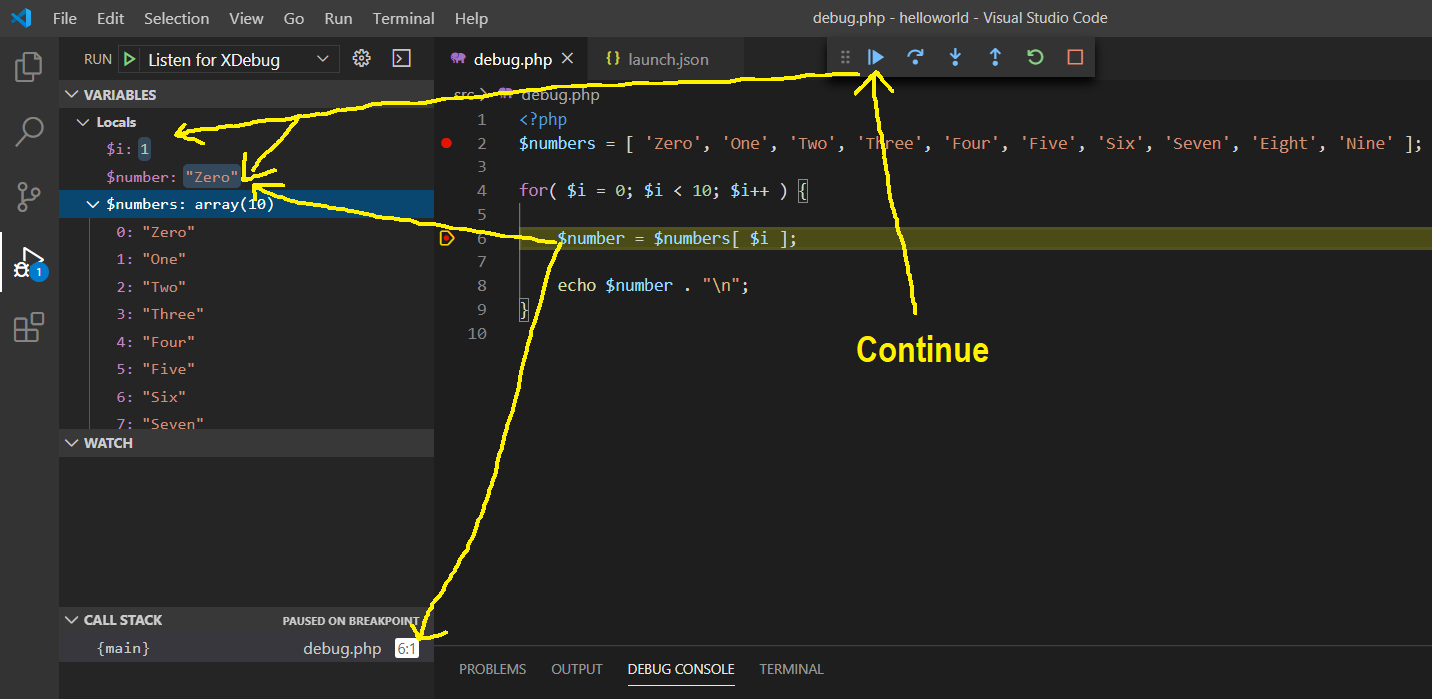
Fig 14
In case of a function call, we can also click the Step Into Icon or press F11 to move the execution to the first statement of the function.
This is all about debugging the source code using VS Code or Visual Studio Code.
Summary
This tutorial provided all the steps to install and configure Xdebug in a Docker container. It also provided the steps to install the PHP Debug extension for Visual Studio Code and to execute and debug our programs.


